AN OVERVIEW OF POLINODE
In case you haven’t seen Polinode in action before - it’s a tool for mapping, visualizing and analysing networks in the browser. With Polinode you can either create Networks, Surveys or both. Polinode Networks gives you the ability to upload any network data you may have to the cloud and then visualize and analyze that data directly from your browser. The source of the data can literally be anything including email communication, 360 degree performance reviews, enterprise social networks, social media, etc.
Polinode Surveys allow you to collect network data using a relationship-based survey tool. For example, you can ask questions such as “Who do you work with often?” or “Who do you go to for advice?”. You can then visualize and analyze this network data in one integrated and highly flexible solution. Applications are many and varied but include change management, identifying emerging talent, M&A integration and improving workplace layouts. This is what we call 'Survey’ functionality and it is most often used for organizational network analysis.
ANNOUNCING THE ADDITION OF 13 NEW METRICS
Today we are thrilled to announce that we have added 13 new powerful metrics designed for the efficient analysis of network data. These metrics are in addition to the seven metrics that were previously available, so there are now a total of 20 metrics that you can calculate using Polinode:
- Average Neighbor Degree
- Betweenness Centrality
- Closeness Centrality
- Closeness Vitality
- Clustering
- Communicability Centrality
- Core Number
- Current Flow Betweenness Centrality
- Current Flow Closeness Centrality
- Eigenvector Centrality
- Harmonic Centrality
- HITS
- In Degree
- K Clique Communities
- Katz Centrality
- Load Centrality
- Louvain Communities
- Out Degree
- Pagerank
- Total Degree
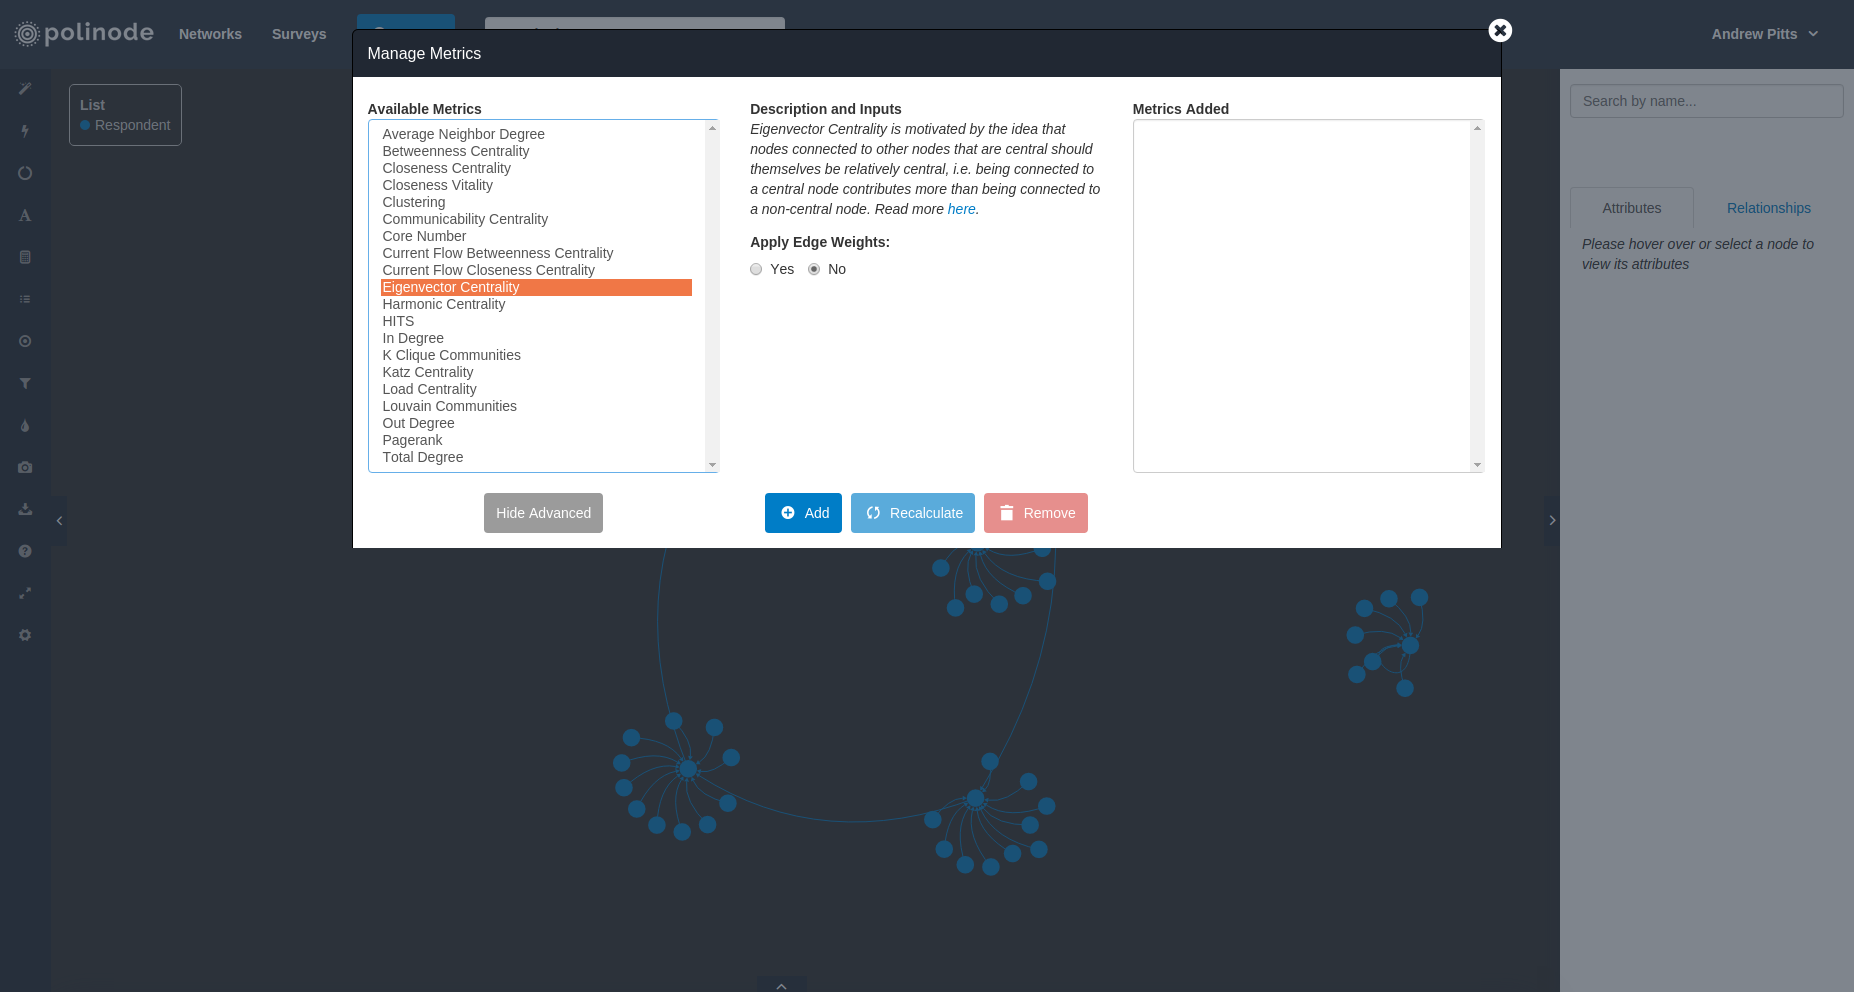
We won’t dive into the details for each of these metrics here but it is worth noting that Polinode now includes a brief overview of what each of these metrics represents - see the screenshot below.
We understand that for some users, a list of 20 metrics can be a bit much so we’ve also created a simpler subset of this list that represents just 7 of the more common metrics:
- Betweenness Centrality
- Eigenvector Centrality
- In Degree
- Louvain Communities
- Out Degree
- Pagerank
- Total Degree
The full list of 20 metrics we call the “Advanced” metrics as opposed to this shorter list of 7 metrics which call the “Regular” metrics. All Surveys - both free and paid - have access to both the Regular metrics as well as the Advanced metrics. All paid Networks also have access to both sets. Free public networks have access to all of the Regular metrics but not the full list of Advanced metrics.
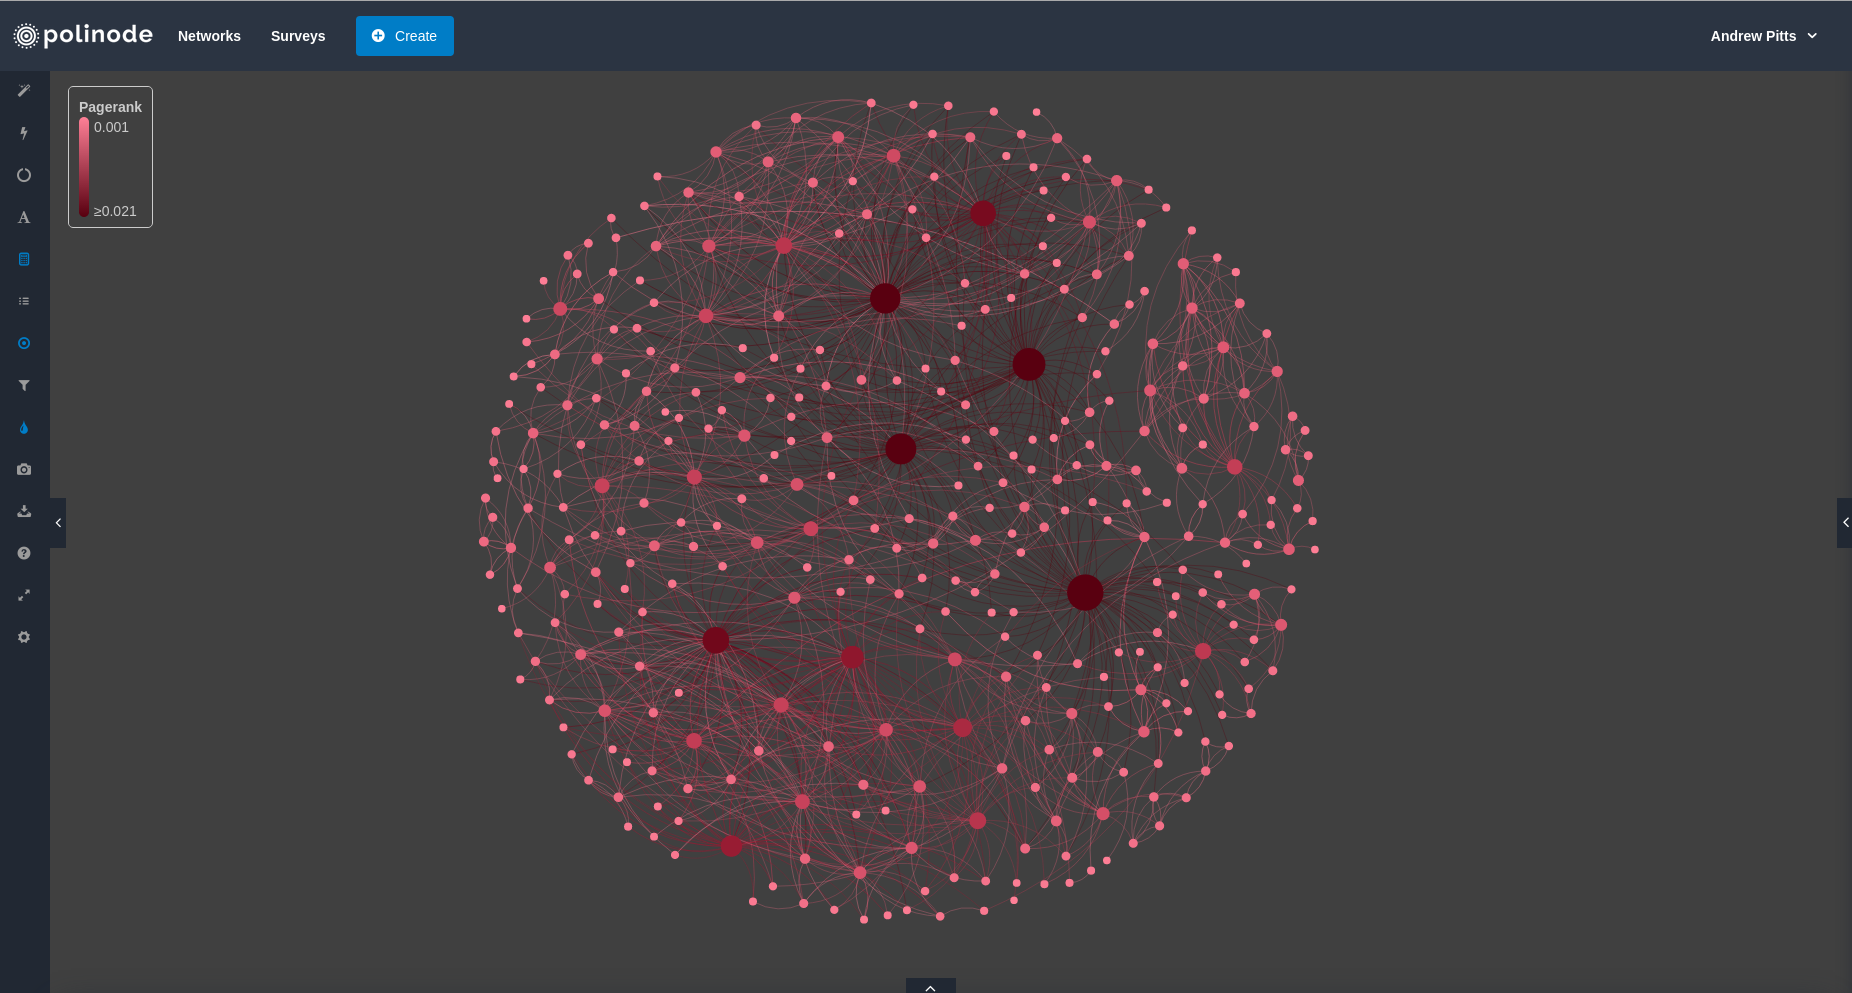
We’ve also taken this opportunity to add the ability to take edge weights into account when calculating metrics in Polinode. So, take Pagerank for example, you now have the ability to take the weights of the connections between each node into account when calculating Pagerank for your network. Below you will find an example of a Pagerank calculation for the Enron email network that every Polinode user has access to and can experiment on. In the below we have both sized and colored nodes by Pagerank.