We recently worked on a particularly interesting project, where we applied a somewhat novel algorithm which we are calling the anti-community algorithm. The purpose of this post is to share the approach we took.
Background
Our client for this project was the division of a large construction company, where the leadership team wanted to better understand how the company’s employees worked together. An active organizational network analysis (ONA) was therefore conducted, whereby each employee completed a survey asking them to identify the key individuals they work with. From the outset, core to this project was to use the ONA as part of an onsite workshop hosted by the leadership team for 50 or so of the division’s mid-level and senior managers.
The leadership team’s purpose for the workshop was to present the results of the ONA and have a discussion with the broader group on ways to improve collaboration. During a prep call to walk-through how the results would be presented, the leadership team also considered how they might sit people at the tables to help generate new ideas and relationships. Through this discussion with the leadership team, an idea emerged that we could use the data collected in the ONA to design an optimal arrangement so as to sit people next to others that they didn’t know or work with closely at the company.
Within a couple of days we had developed what we have termed the anti-community algorithm and ran it on the list of attendees in order to generate such a seating chart for the workshop. Below we describe that algorithm.
The Anti-Community Algorithm
Please note that outputs and discussion below are based on an example dataset rather than the actual dataset for privacy reasons, but the overall process and key takeaways are the same.
It is first helpful to become familiar with one of the key approaches used in ONAs to measure collaboration, detecting informal communities. Communities are non-overlapping groups of relatively closely connected individuals. Identifying the informal communities in an organization reveals how employees are really collaborating independently of the formal organizational structure. Several methods are available for detecting these groups, each offering tradeoffs in speed and quality. Arguably the most commonly applied algorithm is the Louvain method for community detection.
Community detection algorithms are commonly optimized and evaluated using modularity, which measures the extent to which the connections within the groups are stronger than the connections between the groups. More specifically, modularity is the proportion of connections within the given groups minus the expected proportion if the connections were random. In the case of an unweighted and undirected network, modularity can range from -0.5 to 1. A positive value indicates the connections within groups are greater than expected on the basis of chance. Alternatively, a negative value indicates the connections within groups are less than expected by chance.
The following image shows an example network colored by community resulting from the application of the Louvain community detection algorithm. For reference, the modularity score is 0.59.
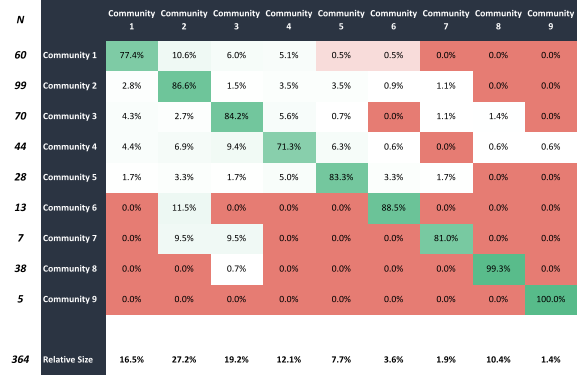
The collaboration matrix below summarizes the interactions between the different communities in the network above. The rows of the table represent the source of the connection and the columns the target. In the first row, for example, 77.4% of the nominations from members in Community 1 were to other Community 1 members, 10.6% were to Community 2, 6.0% to Community 3, and so forth. Notice the green diagonal line starting in the top left corner in relation to the other cells. Like the network image above, It shows that communication is significantly higher within the communities than between them.
Now, with an understanding of how communities are detected and evaluated, we’ll discuss the inverse problem, anti-community detection, why it’s important and how it was applied to find the optimal seating arrangement for the onsite workshop.
In contrast to communities, anti-communities are groups characterized by an exceptionally low number of internal connections and a high number of external connections. Despite being a relatively new concept in network science compared to community detection, especially in the ONA field, a growing body of research and applications in the last few years is starting to reveal how valuable anti-communities are.
As with community detection, a number of algorithmic methods have been developed to find anti-communities. For the purposes of the workshop – namely to have fixed-sized groups of 10 people at each table – we decided to create our own method as most alternatives return variable-sized groups. Also similar to community detection, modularity was used to optimize and evaluate the resulting anti-communities; but, instead of maximizing modularity as with community detection, we minimized modularity to partition the individuals into groups that had fewer internal connections than external connections.
How are anti-communities helpful to understand and improve collaboration? In short, the strength of weak ties. In comparison to the strong bonds and frequent interactions of a family or friend group, weak ties are characterized by infrequent interactions like with those of an acquaintance, stranger, or the barista at your local coffee shop. The utility of weak ties has been extensively researched and explored since the early 1970s, and they have been shown to be crucial for finding employment opportunities, innovation, finding a spouse, and much more (Granovetter, 1973). Within organizations, they represent the connections between different parts of the company, maintaining unity and understanding between employees. Anti-community detection is essentially a method for identifying the potential weak ties in your organization that may be absent, and thus enables leaders to more effectively strengthen organizational resilience, increase innovation and improve company culture.
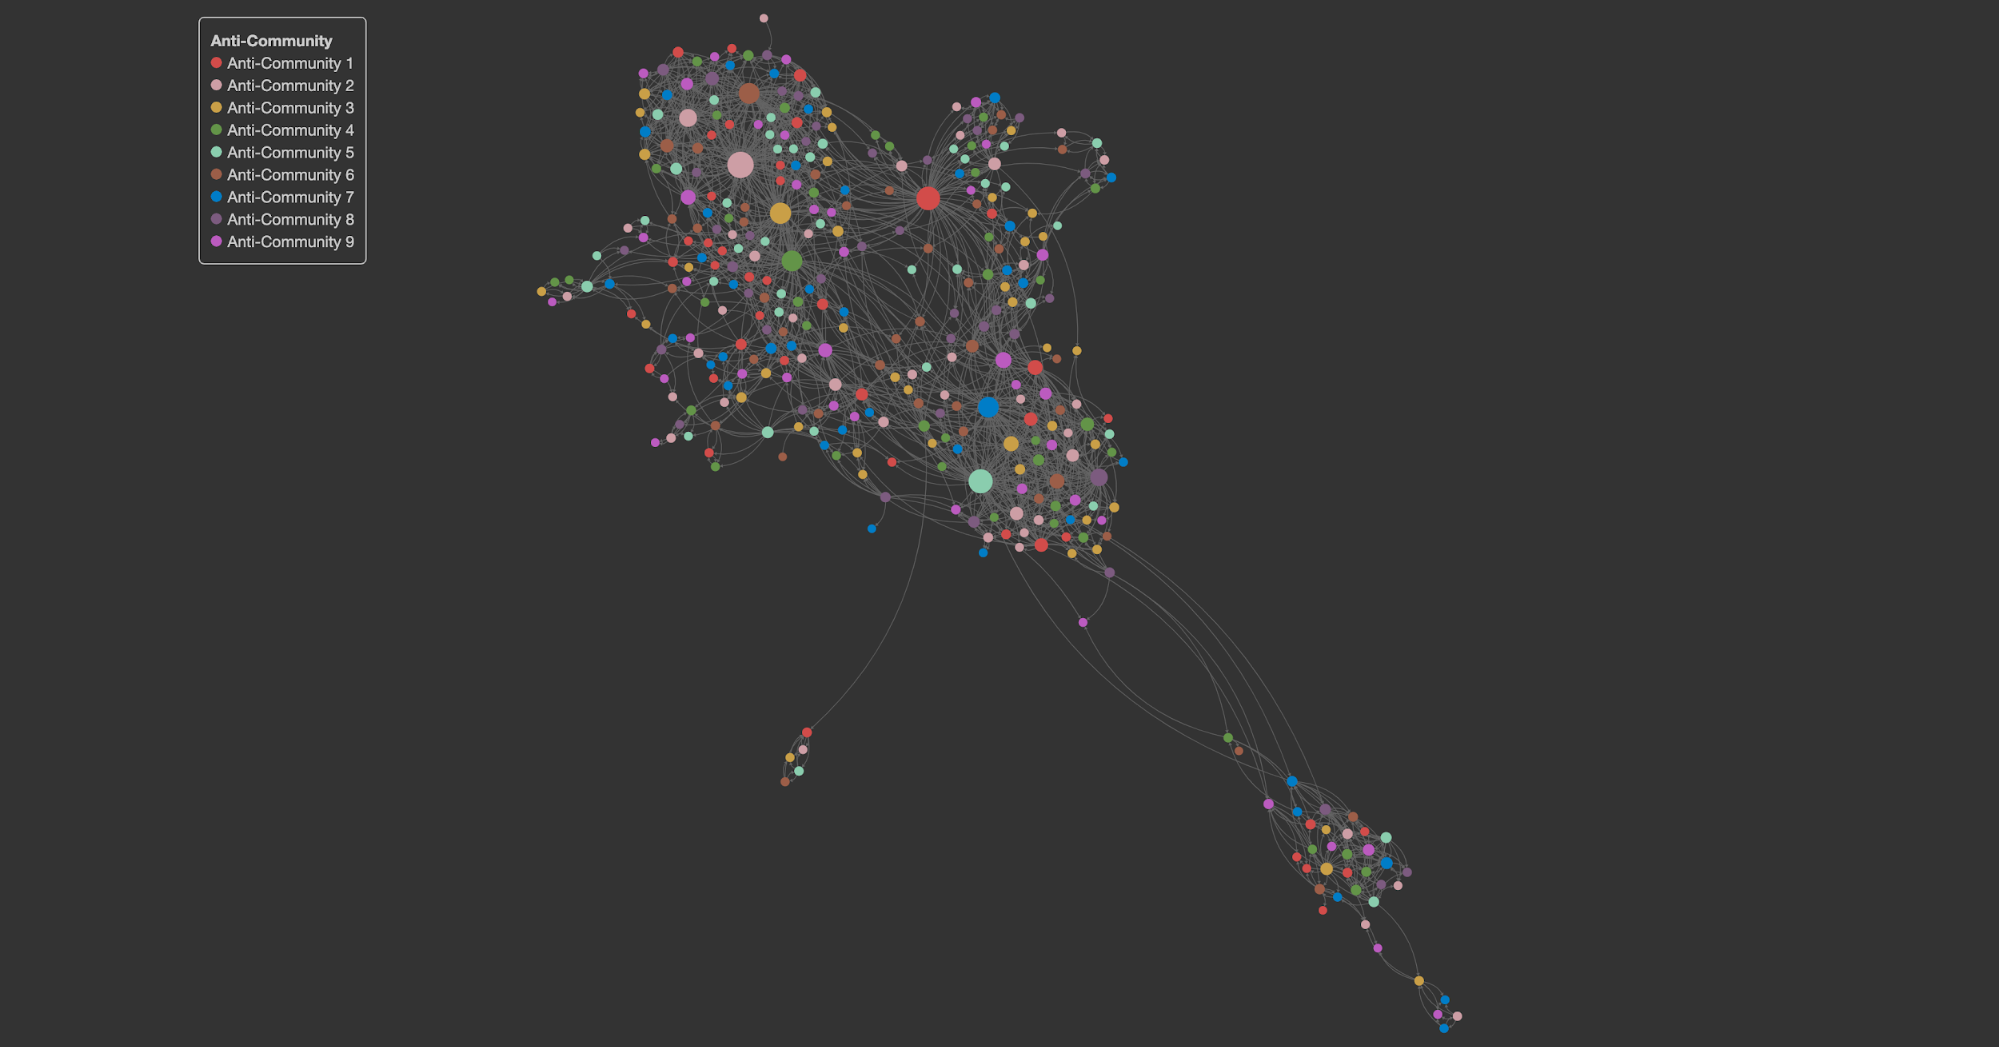
The following image shows the example network colored by the resulting anti-community. For comparison, the modularity score is -0.077.
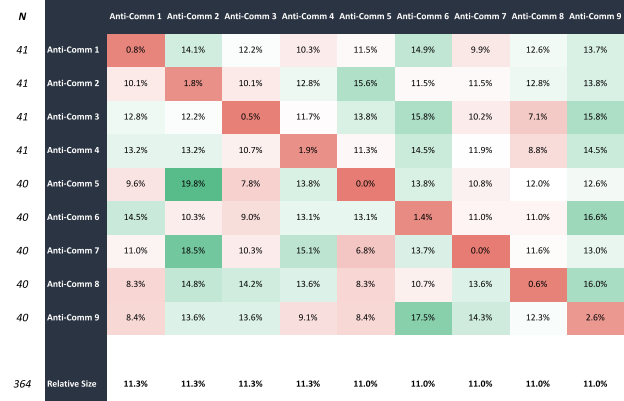
Below is a collaboration matrix by anti-community like the one above for communities. Notice the red diagonal line starting from the top left cell. Inversely to the communities, most of the anti-communities have no or relatively few internal ties.
Results
At the start of the workshop, as people found their assigned tables, the consultant running the workshop and the leadership team noticed a large number of handshakes and introductions as they walked around the room. It was clear that the algorithm had worked as intended, pairing people with others they weren’t connected to. Another interesting and unexpected observation they found was that you might have two good colleagues or friends sitting at the same table who didn’t rely on each other or work with each other much, and so they didn’t nominate each other in the ONA. Though somewhat surprising, it’s a good reminder of the multifaceted nature of human relationships and how they consist of different types of social networks, like coworkers and friends, that can interact in unexpected ways. One of the main advantages of active ONAs is they allow you to target and reveal the various types of relationships.
After seeing the results of the algorithm and the insights generated during the workshop and following discussions, the leadership team came back about a month after the first and asked us to run the algorithm again but on a broader group at the company. The results were similar to those in the workshop and offered another test of validation that the approach worked.
Conclusion
In this post, we’ve discussed one of the ways ONA can be used to improve collaboration in your organization by helping to identify and connect those who aren’t connected. Some of these new relationships will undoubtedly grow stronger over time, but even the ones that don’t, the so-called “weak” ties, are perhaps just as valuable to your organization’s health, if not more so.
If you found this interesting, you may enjoy attending our Polinode Enterprise Connect events. We hold these once a quarter over Zoom and an amazing group of People Analytics Practitioners, Academics and Consultants come together to discuss all things Organizational Network Analysis. Our next event is being held on the 18th of October 2022 and we’ll be talking about the above a bit more. If you would like to receive an invitation (or just learn more about Polinode or ONA generally) please don’t hesitate to reach out to us at info@polinode.com.